| Sitting article III federal Judges (as of Oct. 1, 2023) |
|
U.S. Supreme Court • 9 justices • 5 men, 4 women • 6 white, 2 Black, 1 Hispanic U.S. Courts of Appeals • 299 judges • 202 men, 97 women • 229 white • 31 Black • 20 Hispanic • 16 Asian American • 3 mixed race or ethnicity or other U.S. District Courts • 1,097 judges • 750 men, 347 women • 825 white • 130 Black • 83 Hispanic • 34 Asian American • 4 Native American • 21 mixed race or ethnicity or other |
by Biden
(As of Oct. 1, 2023)
| Black | 31% |
| Asian American | 11% |
| Hispanic | 16% |
| White | 33% |
| Female | 66% |
| Male | 34% |
| Total | 140 |
There were 1,423 sitting federal judges* in the United States on Oct. 1, 2023, and they were overwhelmingly male (68%) and white (76%). But the diversity of the federal bench is changing – especially in the past three years, according to the Federal Judicial Center.
From Jan. 1, 2021, to Oct. 1, 2023, the Senate confirmed 140 new federal judges nominated by President Joe Biden. Only 14 (10% of new federal judges) were white men. The remaining 126 nominees (90%) were women, Blacks, Hispanics, Asians, Native Americans and lawyers of mixed race or ethnicity.
As a result, the percentage of Black judges on the federal bench rose from 9.5% in 2020 to 11.5% as of Oct. 1, 2023. Overall, 163 federal judges identified as Black and another 10 identified as partially Black. The first African American federal judge took office in 1945.
Meanwhile, 7.3% of federal judges in 2023 were Hispanic – up nearly one percentage point from 6.5% in 2020. Overall, 104 federal judges identified as Hispanic and another 11 identified as partially Hispanic. The first Hispanic federal judge took office in 1961.
The share of Asian Americans in the federal judiciary also rose one percentage point – from 2.6% in 2020 to 3.6% in 2023. Overall, 51 federal judges were Asian American and nine others identified as partially Asian American. Also, one judge identified as Chaldean and one as Pakistani. The first Asian American federal judge was appointed in 1971.
Four federal judges are Native American. Two others identify as partially Native American. Those six judges represent just four-tenths of 1% of all federal judges. Nationally, 2.7% of the U.S. population claims Native American heritage, according to the Census Bureau. The first Native American federal judge took office in 1979.
Many women also joined the federal bench from 2021 to 2023. Just over one-quarter of all federal judges (27%) were female in 2020. As of Oct. 1, 2023, nearly one-third (32%) were female. The first female federal judge was appointed in 1928.

Are women and lawyers of color underrepresented on the federal bench? The question has more than one answer.
Compared to the U.S. population, lawyers of color are underrepresented, particularly Hispanics. For example, 7.3% of all federal judges were Hispanic as of Oct. 1, 2023 – less than half the percentage of Hispanics in the U.S. population (19.1%).
Blacks and Asian Americans are also underrepresented compared to the U.S. population, but the difference is not as great. For example, 11.5% of federal judges were Black as of Oct. 1, 2023, compared to 13.6% of the population. Similarly, 3.6% of federal judges were Asian American, compared with 6.3% of the population.
But compared to the pool of U.S. lawyers, from which all judges are drawn, lawyers of color are not underrepresented. For example, 7.3% of federal judges were Hispanic, but only 6% of all lawyers are Hispanic. Similarly, 11.5% of federal judges were Black, compared with 5% of all lawyers. And 3.6% of federal judges were Asian American, compared with 6% of all U.S. lawyers.
Women are also underrepresented on the federal bench compared with their share of the U.S. population, but the gap is not nearly as wide compared with their share of the lawyer population. Of all federal judges, 32% were women on Oct. 1, 2023, compared with 50.4% of the U.S. population and 39% of the lawyer population.
The federal judiciary has become increasingly diverse over time, but the changes aren’t constant. Diversity varies year by year, depending on the president and who controls the Senate.
Among recent presidents, Democrats have appointed many more women and judges of color than Republicans, according to the Federal Judicial Center, the research and education arm of the federal courts.
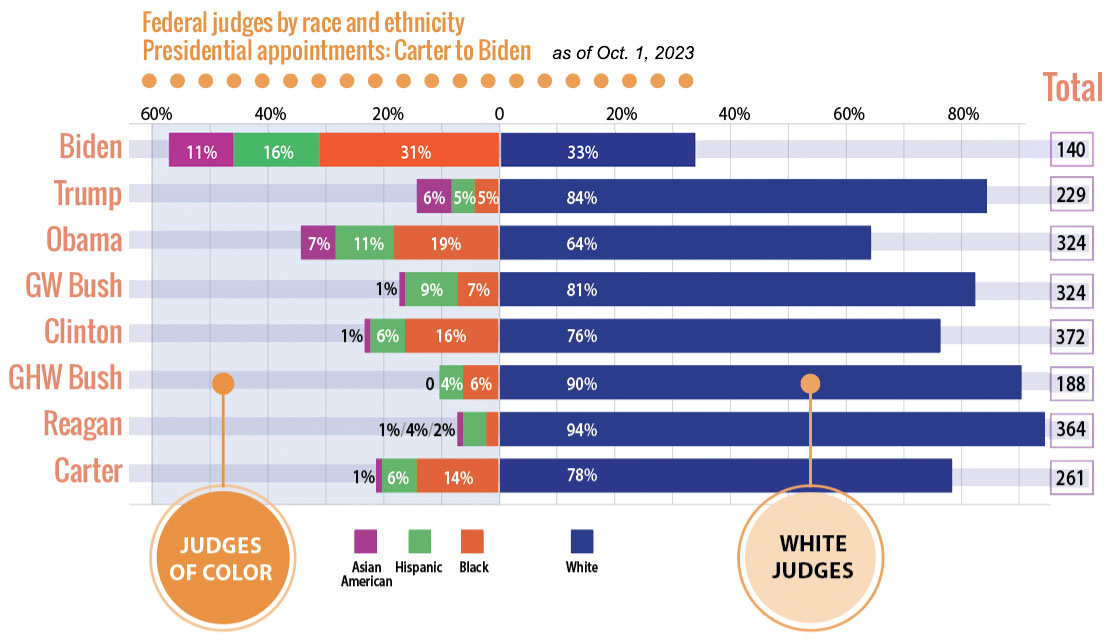
As of Oct. 1, 2023, the Senate had confirmed 140 judicial nominees by President Joe Biden. Two-thirds (66%) were women. Among other recent presidents, only Barack Obama (42%) can say that nearly half of his appointments were women. When it comes to appointing female judges, the other recent presidents are, in order: Bill Clinton (28%), Donald Trump (24%), George W. Bush (22%), George H.W. Bush (19%) and Jimmy Carter (16%). Despite the fact that Ronald Reagan appointed the first female Supreme Court justice in 1981 (Sandra Day O’Connor), only 8% of his judicial appointments were female.
Republicans also were less likely to appoint judges of color. Among the eight most recent presidents, judicial appointments by all four Republicans were more than 80% white: Reagan 94%, George H.W. Bush 90%, Trump 84% and George W. Bush 81%.
As of Oct. 1, 2023, Biden has been the most likely to appoint Black judges (31% of his confirmed nominees), Hispanic judges (16%) and Asian American judges (11%) among the eight most recent presidents.
While much was made of the large number of judges appointed by Trump (229), he actually appointed fewer than another recent one-term president, Carter (261), but more than one-termer George H.W. Bush (188). Recent two-term presidents all appointed more than 300 judges each. In order, they are: Clinton (372), Reagan (364), George W. Bush (324) and Obama (324).
Justices on the top courts of the 50 states are not representative of the nation’s population by gender, race and ethnicity, according to a 2023 study by the Brennan Center for Justice at New York University.
Across all state high courts, 20% percent of justices are people of color. By contrast, people of color are 40% of the U.S. population. Also, 58% of all justices are men, compared to 50% of the population.
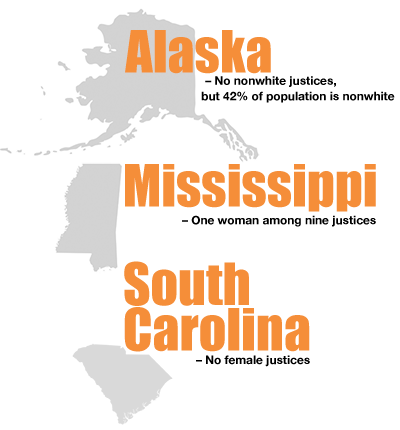
The study found 18 states have no justices of color on their highest courts. In one state, Alaska, nearly half the population (42%) is non-white, but all five justices are white. In Alabama, more than a third of the population (37%) is non-white, but all nine justices are white.
In one state – South Carolina – there are no women among the five justices. In Mississippi, there is only one woman among nine justices.
There are no Native American justices in four of the five states with the largest populations of Native Americans per capita: Alaska, Montana, New Mexico and South Dakota.
Also, two of the five states with the largest Asian American populations per capita do not have an Asian American justice: New Jersey and New York.
Over the past year (May 2022 to May 2023), 32 new state Supreme Court justices took office. Nearly half (15) were women, and more than three-quarters (25) were white.